According to the survey conducted by the American Educational Research Association in 2023, about 60 percent of high school and university lecturers change raw grades at least once during every semester; however, only about 30 percent have a set formula for it. Grade curving without consistency creates inconsistency, unfairness, grading inequality, and risk for the administration. grade curve calculator eliminates such inconsistencies since the same mathematical calculations will be done to all the grades. This article explains what grade curving is, covers every major curving method square root, linear, bell curve, average-based, and standard deviation and shows you how to use the online calculator to curve an entire class set in under a minute.
What Is a Grade Curve — and Why Do Teachers Use One?
A grade curve is an adjustment applied to raw exam scores to produce a final grade that better reflects student learning relative to the difficulty of the assessment. When a well-prepared class consistently scores lower than expected on a fair test, the problem is usually the test itself — poorly worded questions, unexpected difficulty, or material that was not adequately covered in class. Curving grades corrects for the test, not the students.
The process of grade curving is an important part of norm referenced grading, which is a grading scheme in which a student receives a grade depending on their performance compared to other students' performance in the same course. In norm referencing, the best performing students automatically get. As regardless of their actual scores. Both criterion referenced grading and norm referenced grading are legitimate methods of evaluating students' work and performance, and grade curve calculators are useful in both cases.
The aim of every grade curve is always the same, which is to produce a consistent final grade. The curve calculator eliminates both.
Types of Grading Curves: Which One Should You Use?
No single curve method suits every situation. Each produces a different distribution of final grades and has different effects at different raw score levels. Understanding the types of grading curves helps you choose the right one for your context before running the calculation.
The Square Root Curve: The Most Common Method
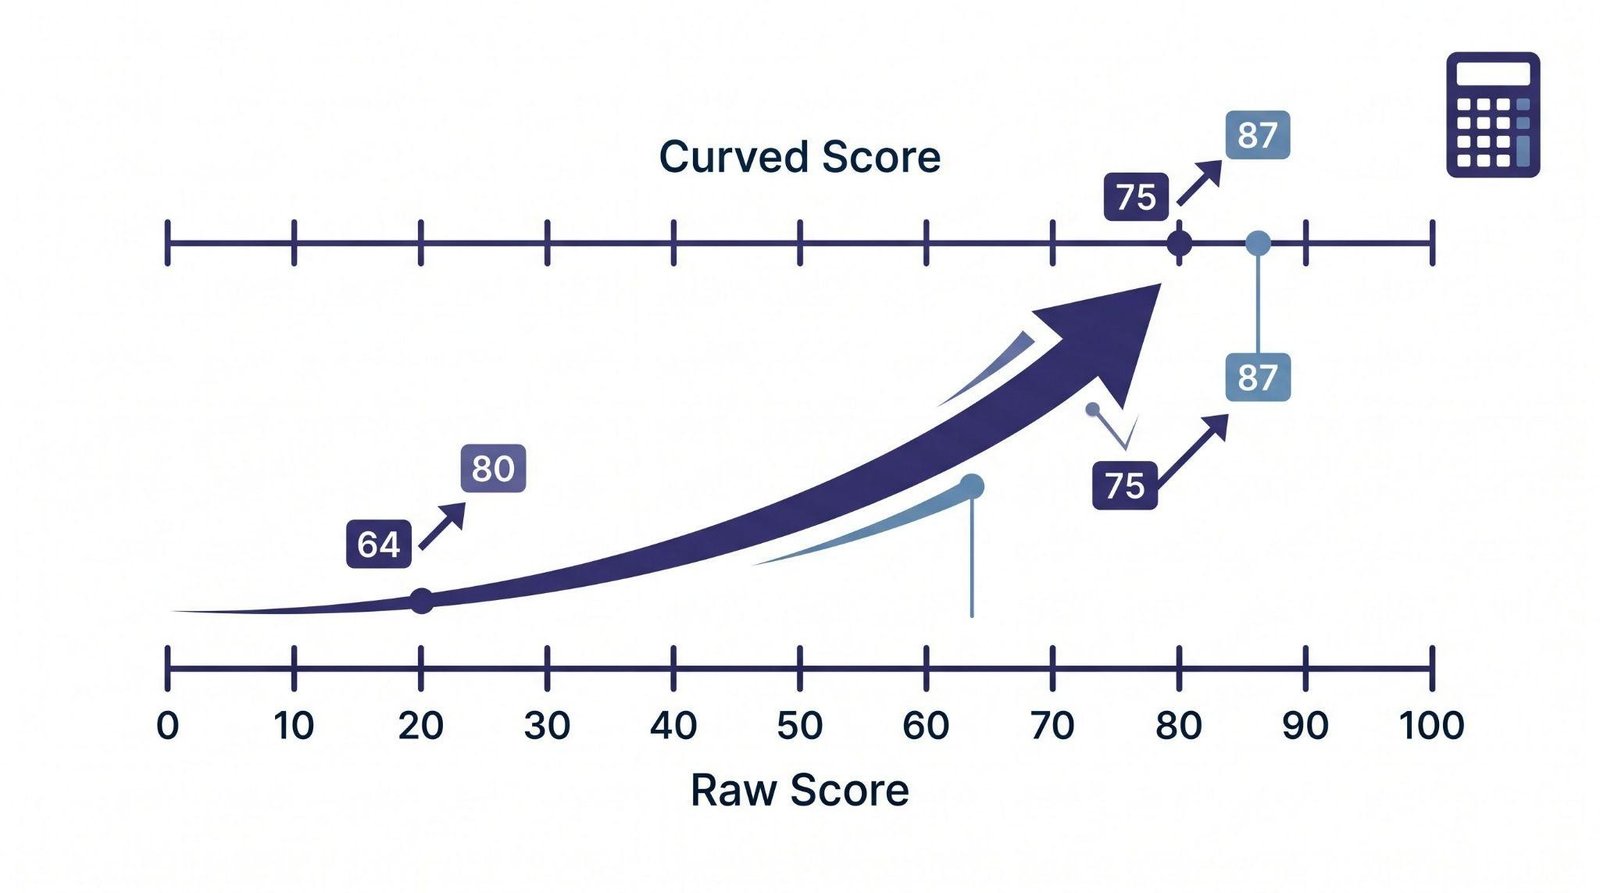
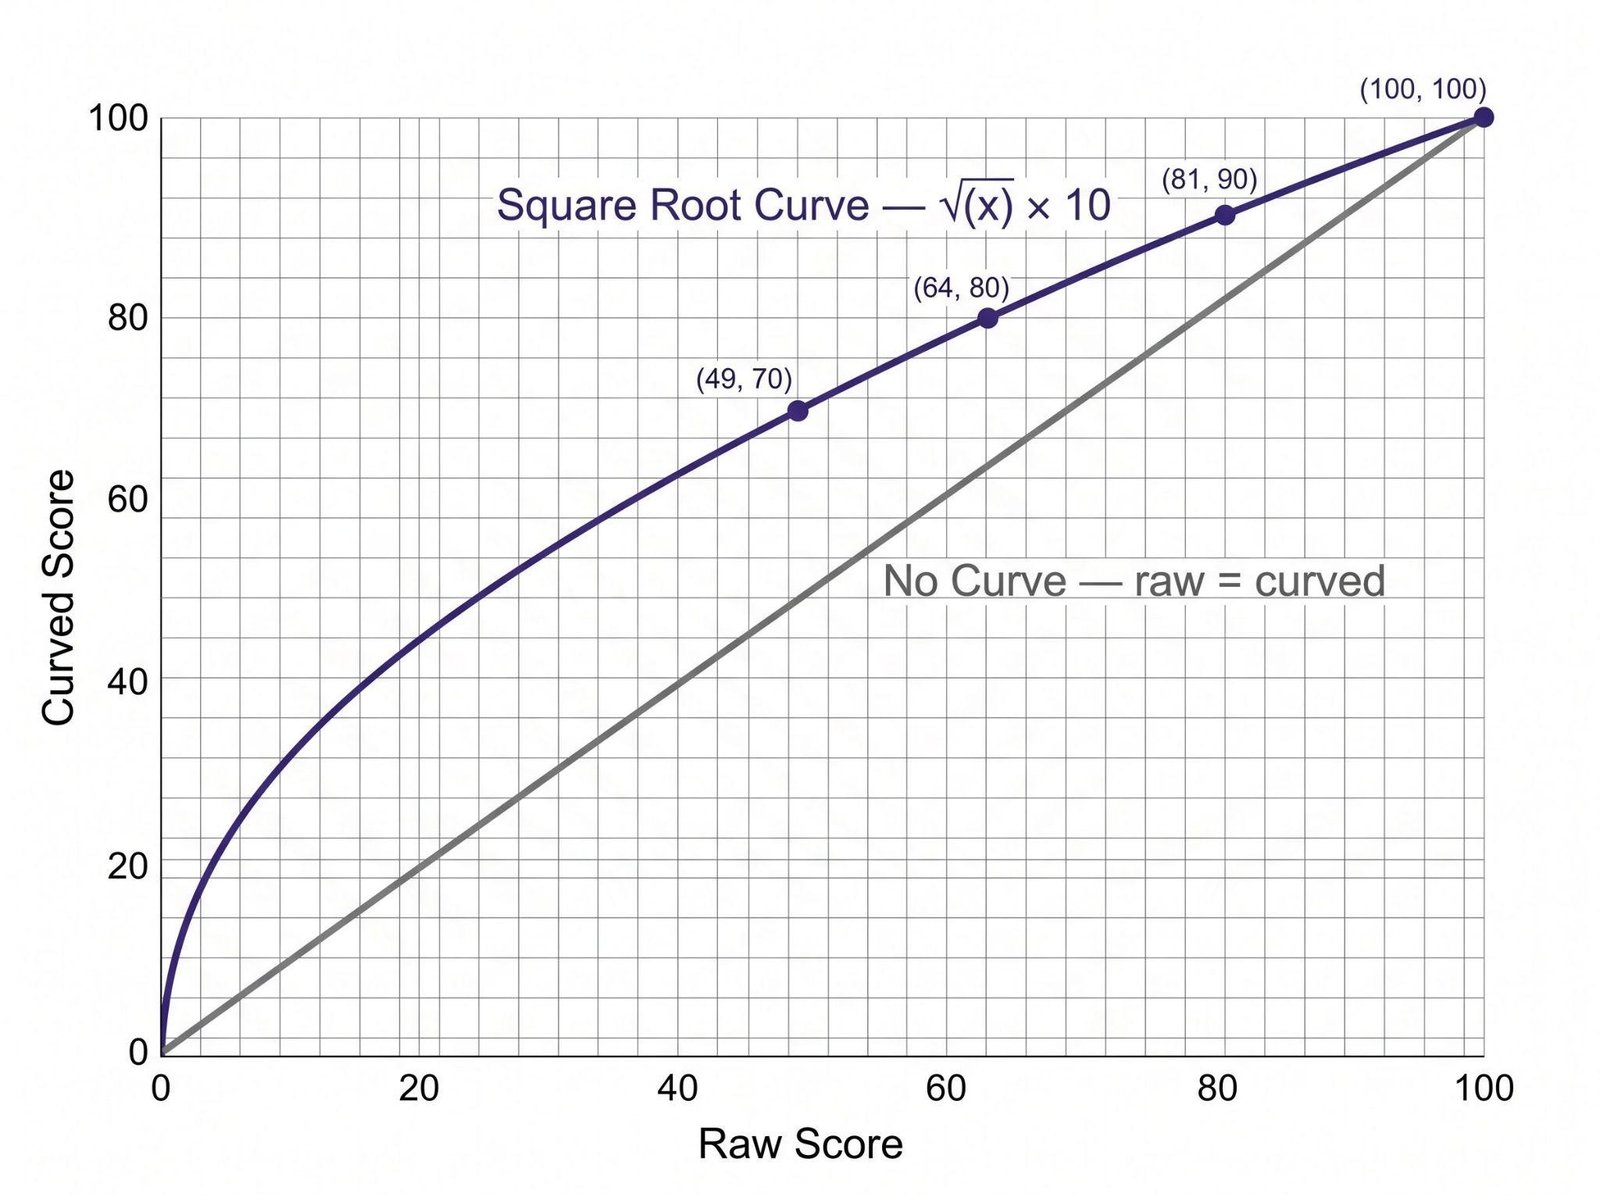
One of the most popular ways to curve grades is to use the square root curve (or sqrt curve/root curve). The formula for this grading curve looks like this: Curved Score = √(Raw Score) × 10. On the scale of 100 points, for example, a student with 64 raw will receive 80 curved points. A student who scores 49 raw receives a curved grade of 70.
The square root curve disproportionately helps students at the lower end of the scale, which is its primary appeal — it compresses the penalty for missing marks without changing the outcome for students who already scored well. The student with 100 raw points will keep the same score after the curving process. Below is the full chart of grade curving on the scale of 100 points.
The Linear Curve: Adding Fixed Points
A linear curve adds a fixed number of points to every raw score equally. Suppose the maximum raw score in the class was 88 points and the lecturer wants the best score to be 100 points. In this case, the formula for linear grade curving would be +12 points for each student. Calculation of curved score by linear grade curve calculator is the addition of raw score and adjustment: Curved Score = Raw Score + Adjustment
Linear grade curve is easy and straightforward. Its limitation is that it does not compress the grade distribution the gap between the highest and lowest scores remains the same after the curve. If one student scored 88 and another scored 40, the linear map calculator returns 100 and 52 respectively a 48-point spread before and after the curve. The square root method would return a much smaller spread.
The Bell Curve Method: Norm-Referenced Grading
Letter grading in accordance with the bell curve grading system takes into account the distribution of scores across the class. The instructor decides the number of students that will fall under each band. For example, A – the highest 10% of students, B – the next 25%, C – the middle 30%, D – the next 25%, and F – the lowest 10%. Bell curve grade calculator determines grades on the basis of students' ranking rather than scores directly.
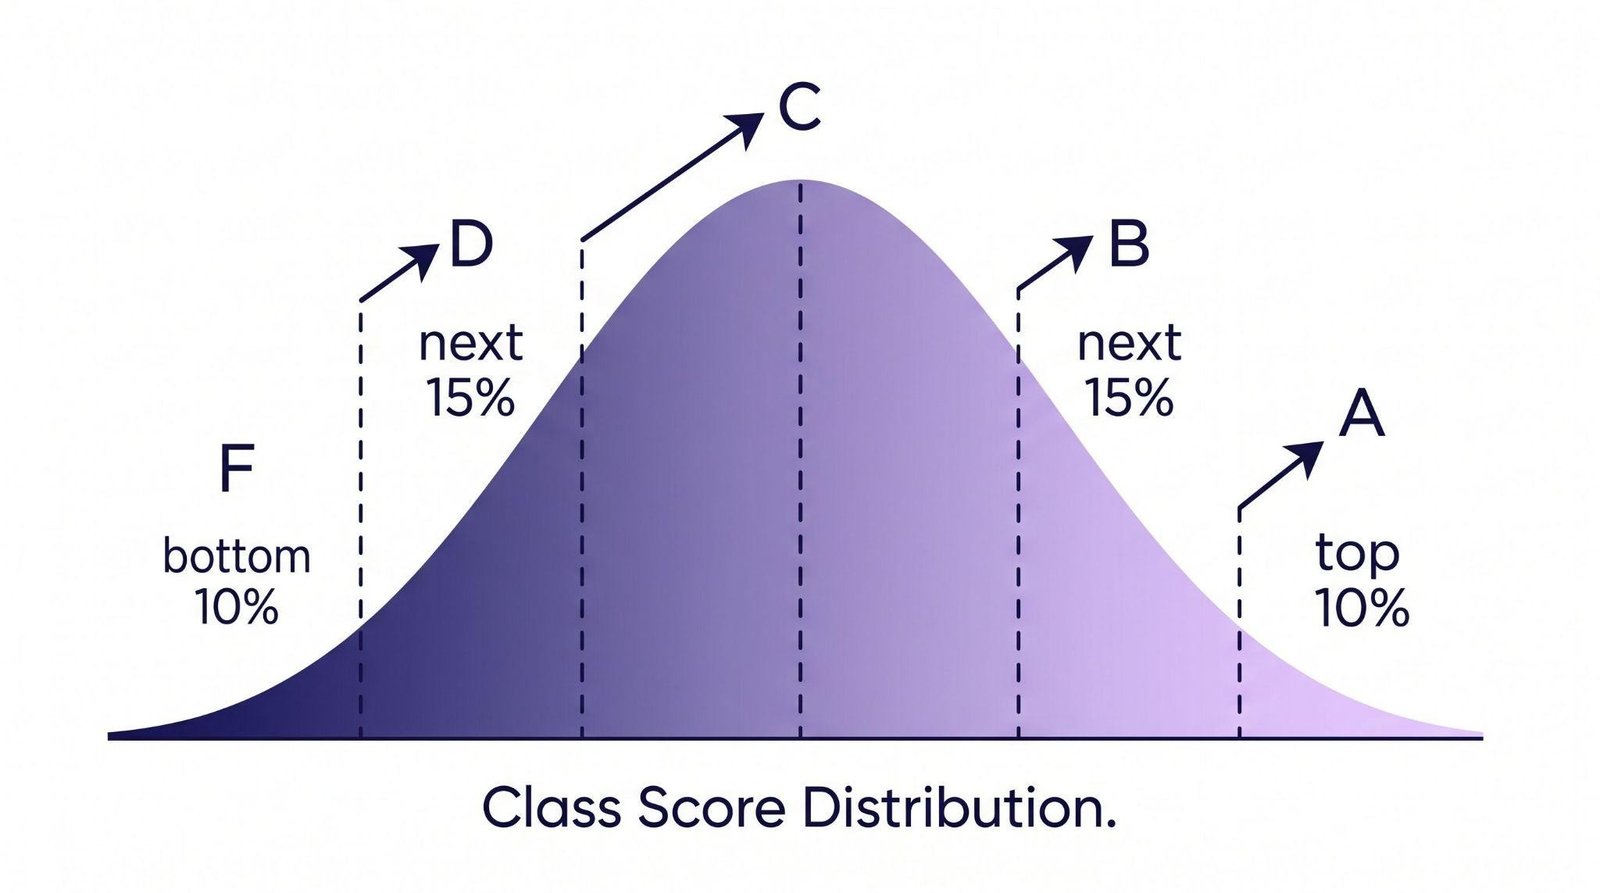
Some people say this setup locks in a fixed grade spread no matter how hard the test is. You often see it in big college lecture classes. It is also used in law school classes and in some professional licensing exams. Critics argue that it can push students into extra rivalry. They also say it can bring down grades when the group does well. Supporters say it holds up better against grade inflation than other methods.
Average-Based Curving and Standard Deviation Curves
With average-based curving, the class mean is fixed at some target value and every score is adjusted so that the class mean equals the target value. An average-based grade curve calculator requires the calculation of the difference between the class mean and target mean, and then all scores are adjusted according to this difference. As an example, when the mean is 68 but the target mean is 75, all scores would be adjusted upwards by 7 points. The average calculator can be used to find the class mean from raw scores.
The grade curve calculator that uses standard deviation does more than that: it standardizes the scores based on the class average, and then adjusts them for a new target mean and standard deviation. This method controls both the average and the spread of the grade distribution simultaneously. It is the most mathematically sophisticated curving method and is used in professional certification and standardized test scoring. The standard deviation calculator computes the necessary inputs if you are applying this method manually.
Specialty Curves: Law School, Texas Curve, and Grade Distribution
Law school curve calculators implement the mandatory curve requirements found at many US law schools, where the median grade must fall within a specified range (commonly B or B−) regardless of performance. A grade curve tool in law school works with raw marks. It figures out what change is needed so the middle score lands on the grade you want.
The Texas curve is not a math equation. It points to a rule in Texas education law, Texas Education Code section 28.0216. That rule says schools must let students try again on an assessment when a failing result would keep them from graduating. A grade distribution report shows how letter grades are spread in two states: before a curve and after a curve. This helps with admin updates and with checking instruction.
Square Root Curve Chart: Reference Table for 100-Point Exams
Curved Score = √(Raw Score) × 10
| Raw Score | √(Raw Score) | × 10 = Curved Score | Letter Grade |
|---|---|---|---|
| 25 | 5.00 | 50 | F → F (significant curve) |
| 36 | 6.00 | 60 | F → D (passes with curve) |
| 49 | 7.00 | 70 | F → C (two letter grade jump) |
| 55 | 7.42 | 74 | F → C+ (large improvement) |
| 60 | 7.75 | 77.5 | D → C+ |
| 64 | 8.00 | 80 | D → B- |
| 70 | 8.37 | 83.7 | C- → B |
| 75 | 8.66 | 86.6 | C → B+ |
| 80 | 8.94 | 89.4 | B- → B+ |
| 90 | 9.49 | 94.9 | A- → A |
| 100 | 10.00 | 100 | A → A (no change at top) |
How to Calculate a Grade Curve: The Formulas
Square Root Curve Formula
Curved score formula: Curved Score = √(Raw Score / 100) × 100. In case of 100 point scale, it looks like Curved Score = √(Raw Score) × 10. Given the raw score 72, √72 = 8.485. Multiplying by 10, we get 84.85. Rounded to 85. Another example. Raw score 55, √55 = 7.416. After multiplication by 10 we get 74.16 rounded to 74. There is also an option to determine the percentage calculator change between two scores entered in the tool.
Linear Curve Formula
The other curved method involves adding points. It can be expressed in the following form: Curved Score = Raw Score + (100 − Max Score in Class). This can be simplified to: Curved Score = Raw Score + N. In this case N is the number of points added. If it’s a +7 curve, a raw score of 63 equals 70. The linear map calculator on this page applies any N value across the full class set instantly.
Bell Curve and Standard Deviation Grading
Standard deviation curve method uses two steps.
First formula: Standardized Score = (Raw Score − Class Mean) ÷ Class SD
Second formula: Curved Score = (Standardized Score × Target SD) + Target Mean
Example with numbers: class mean 65 and class SD 12. Target mean is 75 and target SD is 10. If a student has a raw score of 77:
Standardized = (77 − 65) ÷ 12
Standardized = 1.0
Curved = (1.0 × 10) + 75
Curved = 85
The average calculator first finds the class mean from the raw scores. Then it applies the formulas above.
How to Use the Grade Curve Calculator
Step 1: Select your curve method square root, linear, bell curve, average-based, or standard deviation.
Step 2: Enter the raw scores. You can input a single score or a full class set, depending on the method.
Step 3: Enter any required parameters point adjustment for linear curves, target mean for average-based curves, or target mean and SD for standard deviation curves.
Step 4: Click Calculate. This grade curve calculator displays the curved score along with the letter grade for each entry, and also the class grade distribution summary in the case of class sets.
Step 5: Review the grade curve chart output. Export or copy the results directly into your gradebook.
Key Features of This Curve Calculator
Multiple curve methods: Square root, linear, bell curve, average-based, and standard deviation all in one tool.
Single score or full class: Enter one score to preview the result, or a full class set for batch processing.
Instant results: Curved scores appear immediately with no page reload.
Letter grade output: Each curved score maps automatically to the standard letter grade scale.
Free and no sign up: Grade Curve Calculator is completely free and no sign-up needed.
Mobile friendly: Use on mobile phones and tablets.
Who Uses Grade Curving — and When It Is Appropriate
Classroom teachers use exam curve calculators after difficult tests where the class mean falls significantly below the intended target. A well-designed test should produce a class average between 70% and 80% when the average falls below 65%, a curve is typically appropriate. When it falls below 55%, the test likely needs revision regardless of whether a curve is applied.
University professors use bell curve grading and standard deviation methods in large courses where grade inflation is a concern and a relative ranking system is preferred. The final grade calculator is the natural next step after curving: once curved exam scores are confirmed, the final grade calculator weights them alongside coursework and participation grades.
Exam boards and certification authorities use grade curving to equate different exam versions — ensuring that a student who sat a harder version of a licensing exam is not penalized relative to a student who sat an easier version. This is called statistical equating and uses the same standard deviation principles as the classroom methods above, at a much larger scale.
Frequently Asked Questions About Grade Curves
Q: Does curving grades always raise them?
In most cases, yes. While squaring root, linear, and averaging techniques tend to boost all grades equally or proportionately, the bell curve and standard deviation techniques may in theory reduce grades for the best performing students while increasing the grades for the least performing students, as they adjust the grades based on normalizing the grades and not increasing the grade scale. The most common application of the bell curve technique by teachers is to maintain grade distribution.
Q: How is the square root curve different from adding points?
Adding points (linear curve) gives the same benefit to every student regardless of their original score. The square root curve gives more benefit to lower-scoring students and less to higher-scoring ones. A Student who received 40 in raw grade receives 23 points increase in grade through the use of the squaring root curve method (40 -> 63). Student who received 80 in raw grade receives only 9 points increase (80 -> 89).
Q: What is the Texas curve in education?
The Texas curve is not a mathematical grading formula. This is mentioned in Texas Education Code §28.0216, which says that any student scoring less than 70 in the test should be allowed to have the chance of repeating the test before getting the failing grade. The grade recorded must be the higher of the two scores. It is a state education policy, not a calculation method, and applies to K–12 public schools in Texas.
Q: Should I curve my class's grades?
A curve is justified when the class mean is significantly lower than intended and the test design not student preparation is the likely cause. This means that if you have taught the lesson in the manner intended and the well-prepared class averages 55% then your test was probably too hard. Curve would not be necessary to make up for the poor grades without analyzing the reason for the poor grades. Applied correctly, it is a fairness mechanism; applied automatically, it erodes the meaning of the grading scale.
Q: Can I curve an exam without using all scores?
Yes. Some instructors drop the lowest score in the class before setting the curve reference point, particularly for average-based and bell curve methods. Others may choose to disregard the outliers in order to have one or two students who did not attend classes and so their score is zero before calculating the mean score of the whole class. The curve generator can accept any number of scores and calculate the curve for you. Curving grades in the right manner is a legitimate instructional tool.
Curving grades in inconsistent manner without a formula is simply inequity. The free grade curve calculator applies a consistent, documented formula to every score so the curve you apply to the first student is identical to the one applied to the last. All calculators are free and permanently available at EasyFreeCalculator.